Game of Life
Fun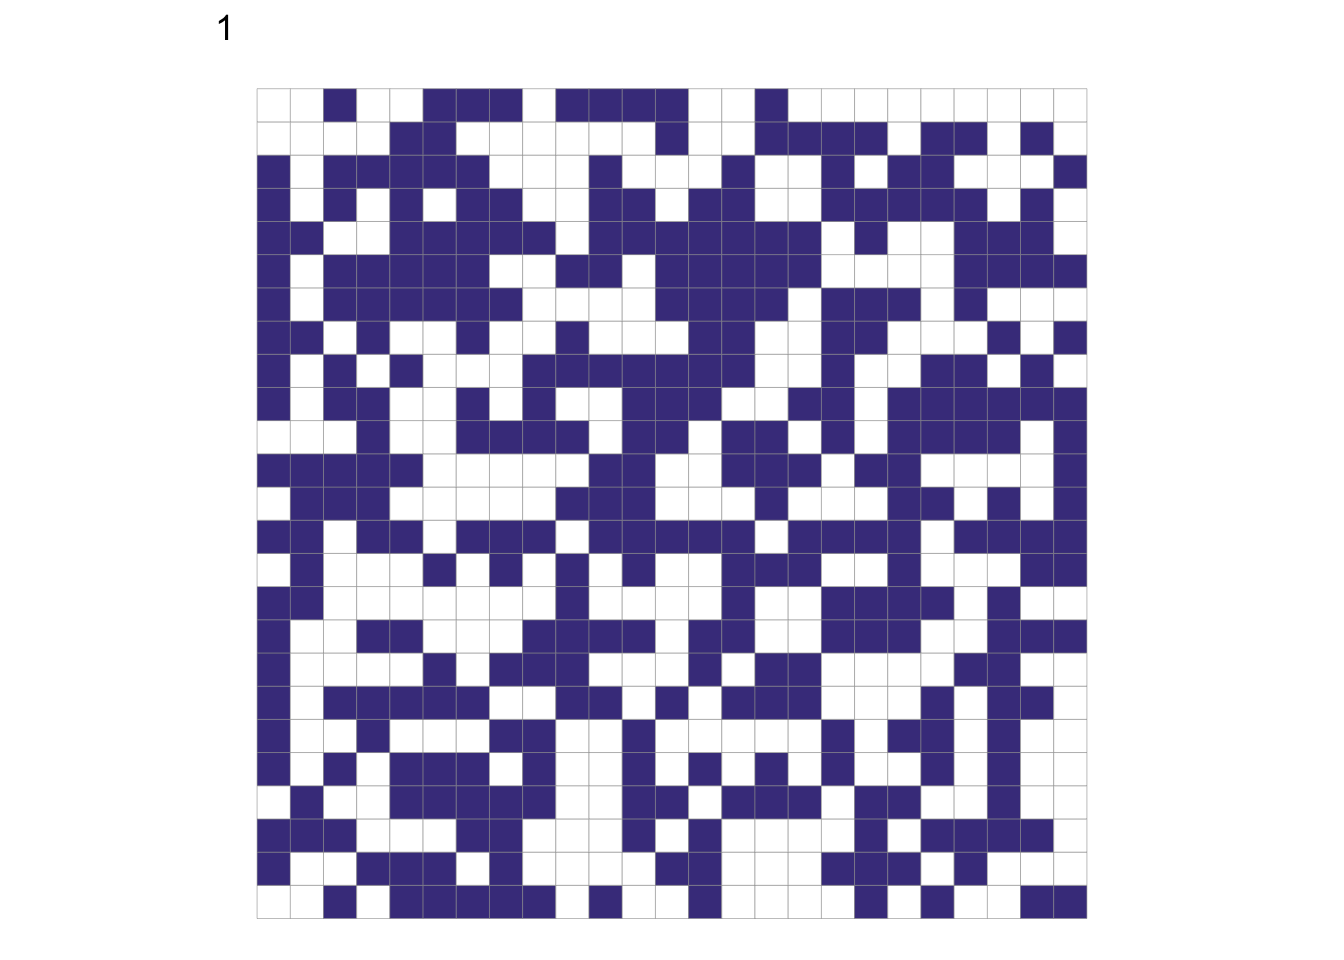
I recently heard about Conway’s Game of Life and it sounded like a fun puzzle for me to code in R.
Game of Life Rules
- Any live cell with fewer than two live neighbours dies, as if by underpopulation.
- Any live cell with two or three live neighbours lives on to the next generation.
- Any live cell with more than three live neighbours dies, as if by overpopulation.
- Any dead cell with exactly three live neighbours becomes a live cell, as if by reproduction.
My version of the GoL creates a function ‘gens’ that takes paramenters (all integers):
- ncols - number of columns in the grid
- nrows - number of rows
- lives - number of iterations/generations
- seed (optional) - if you want to set a random seed for reproducibility
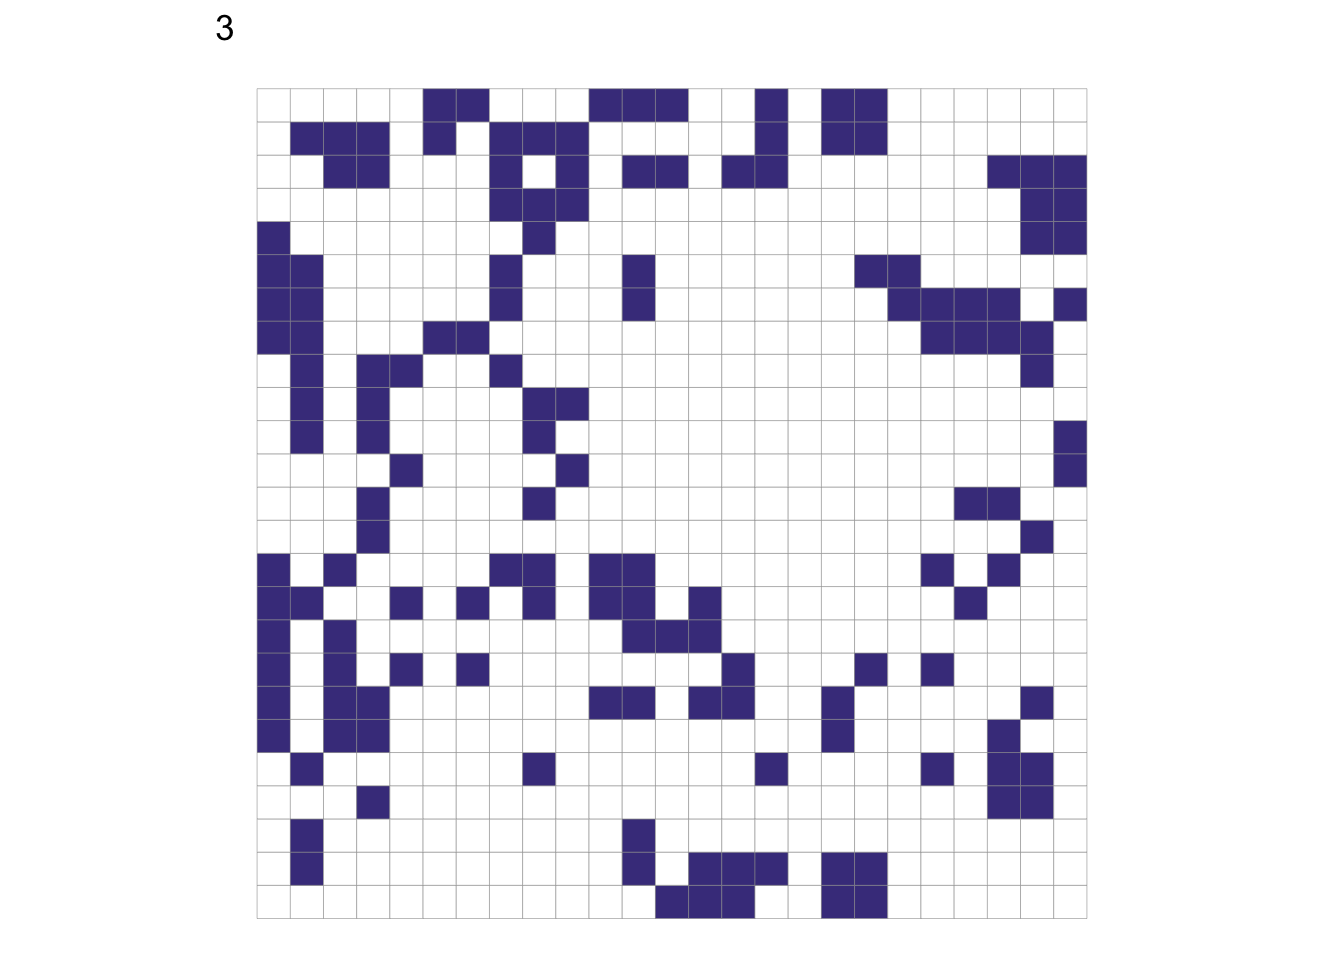
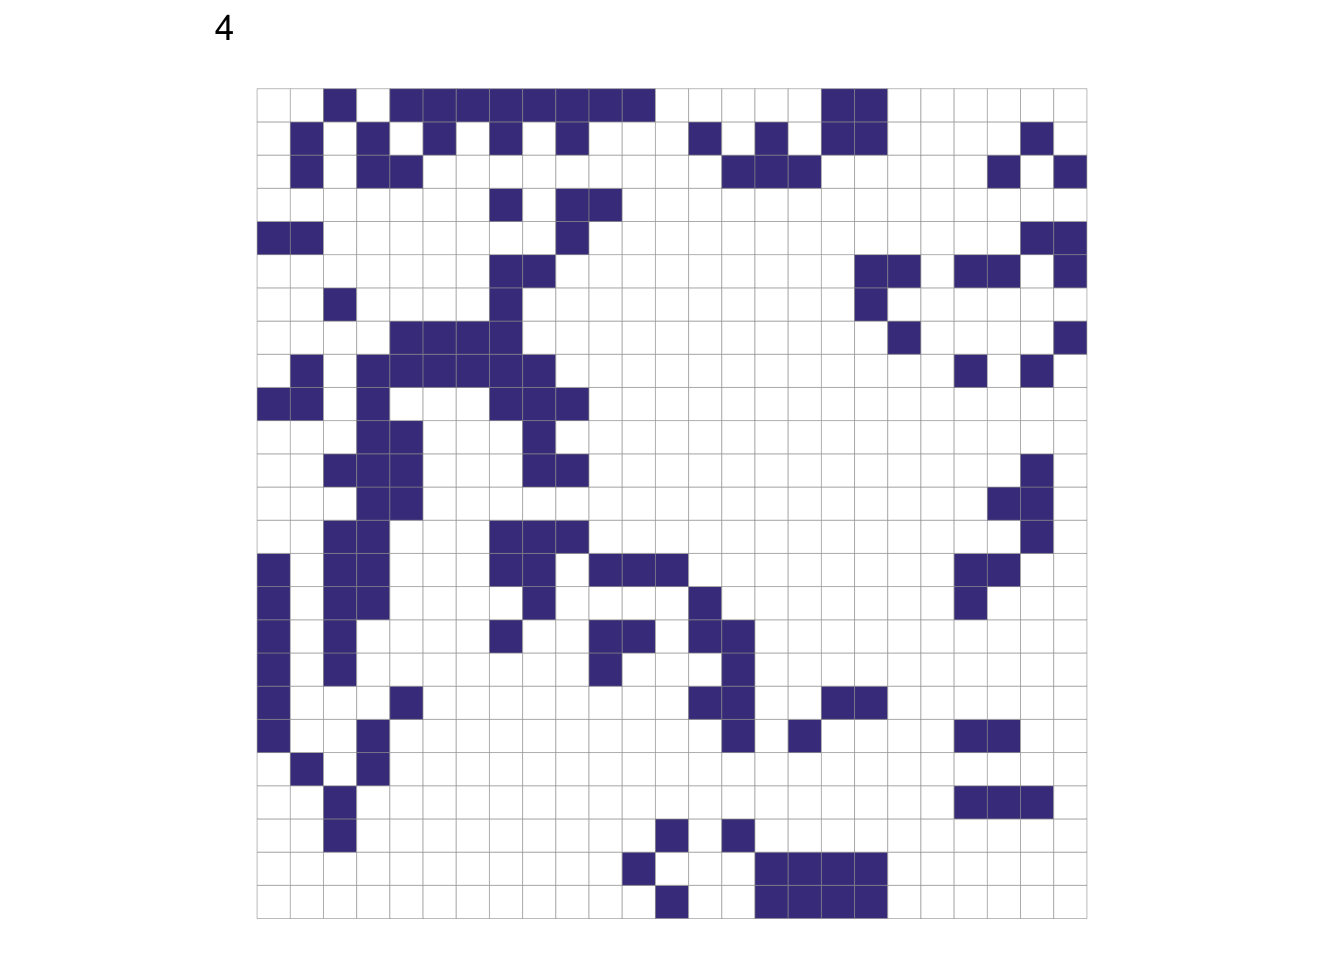
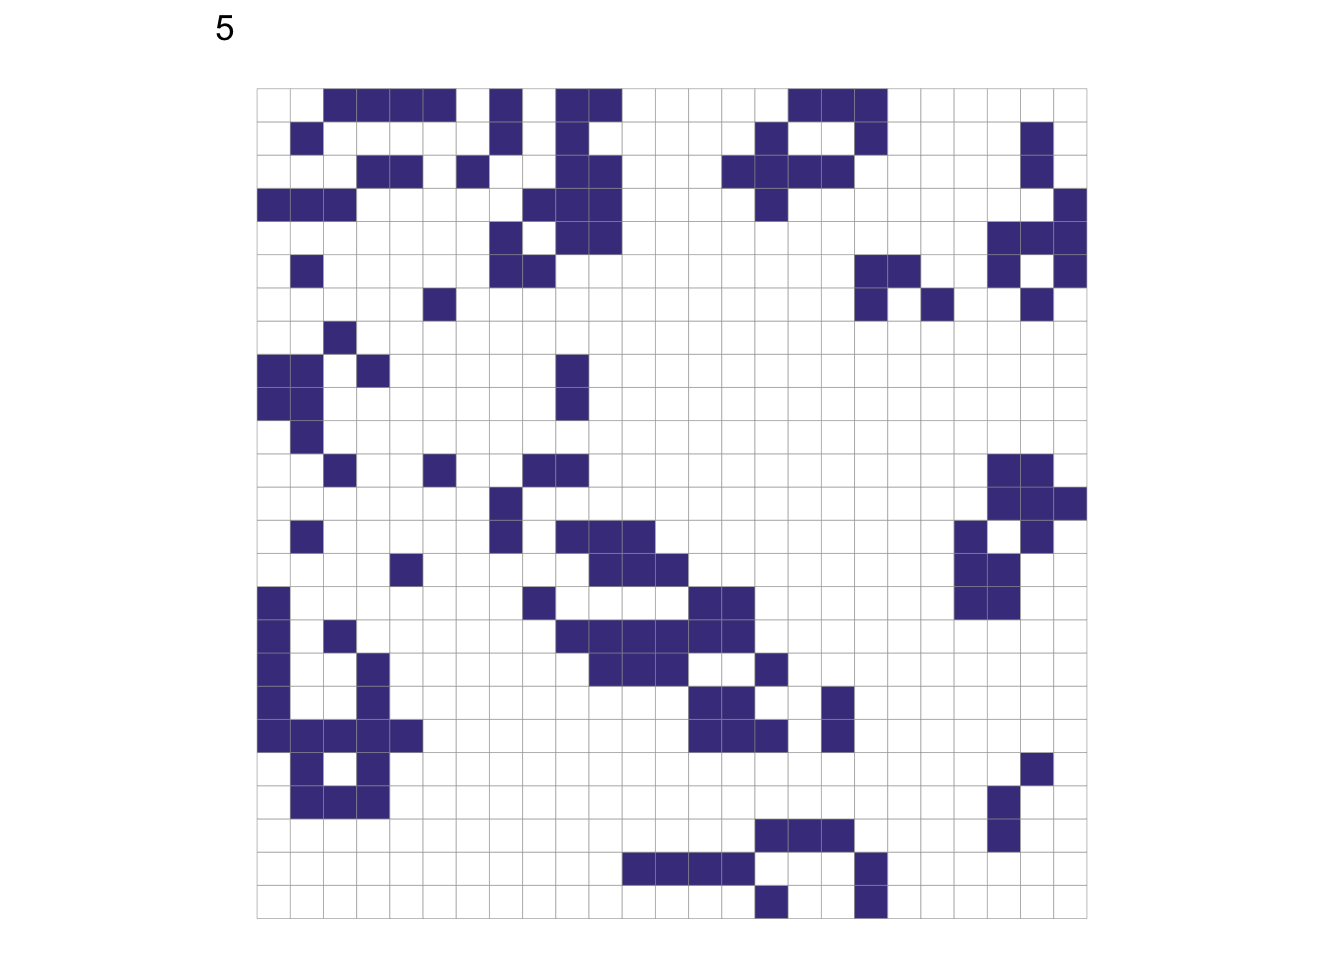
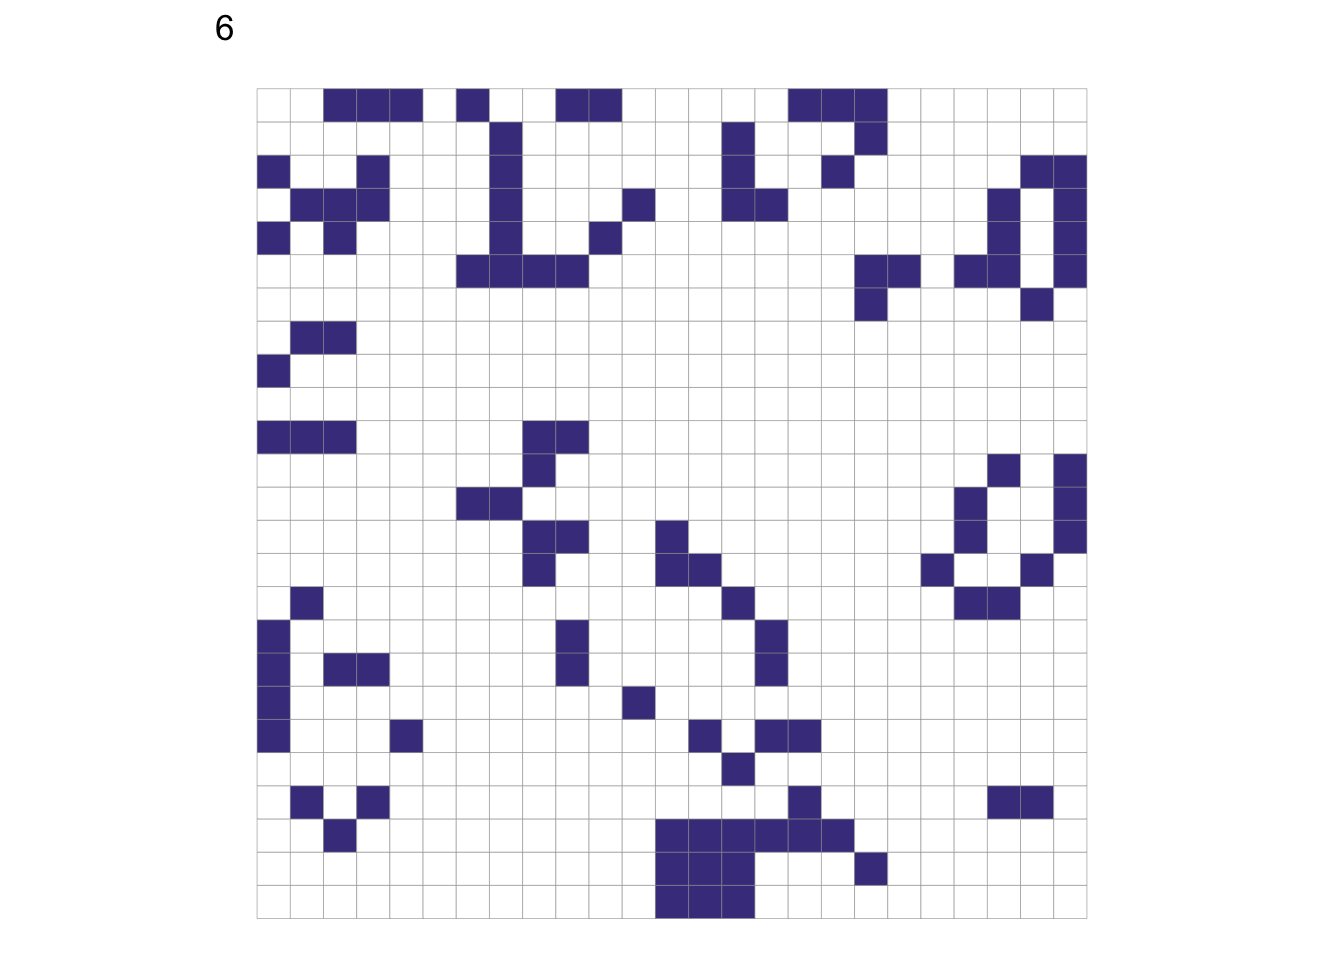
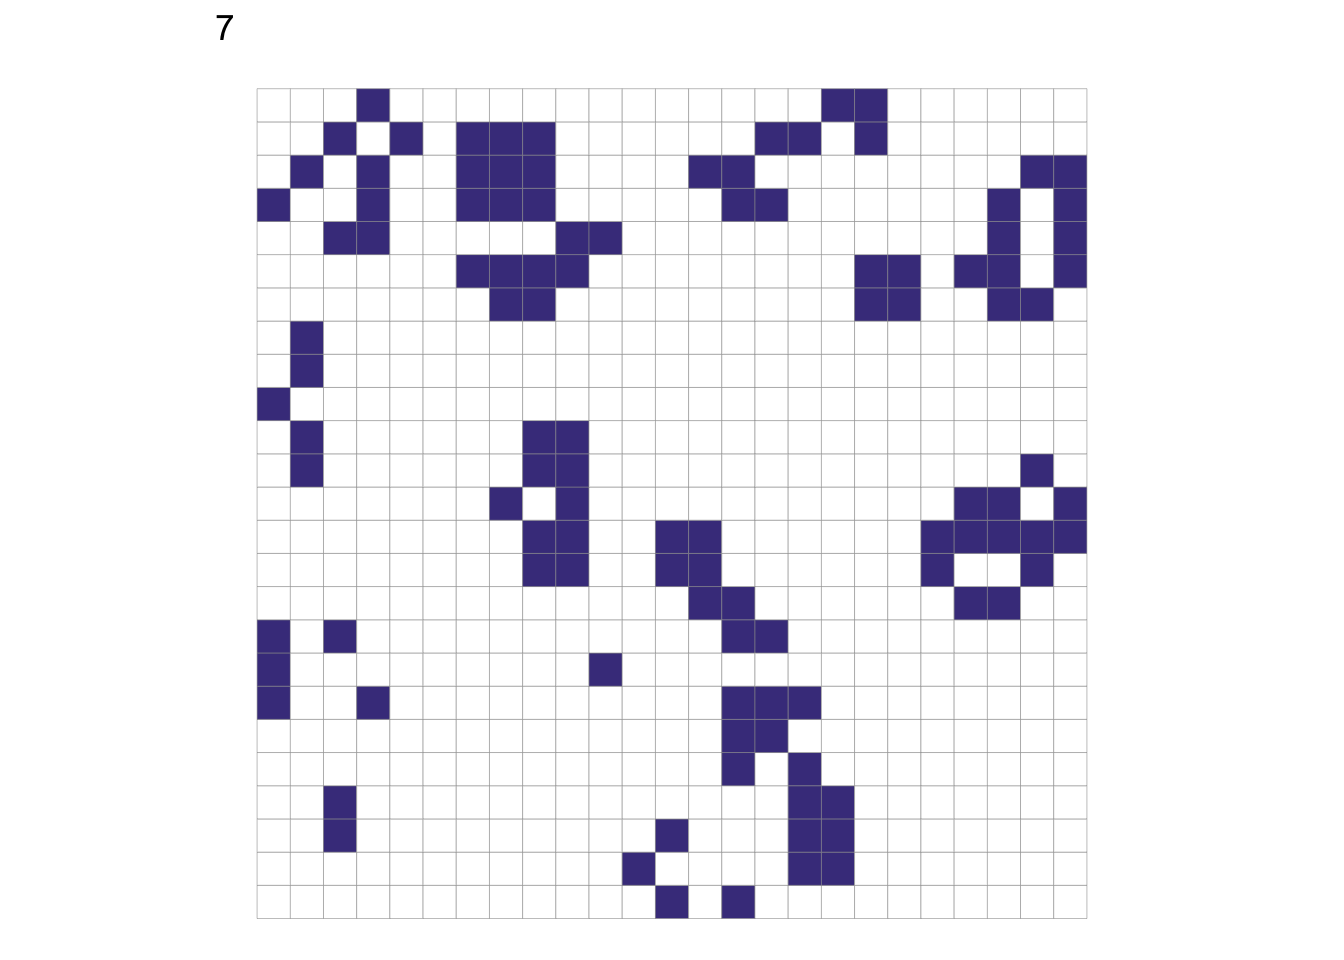
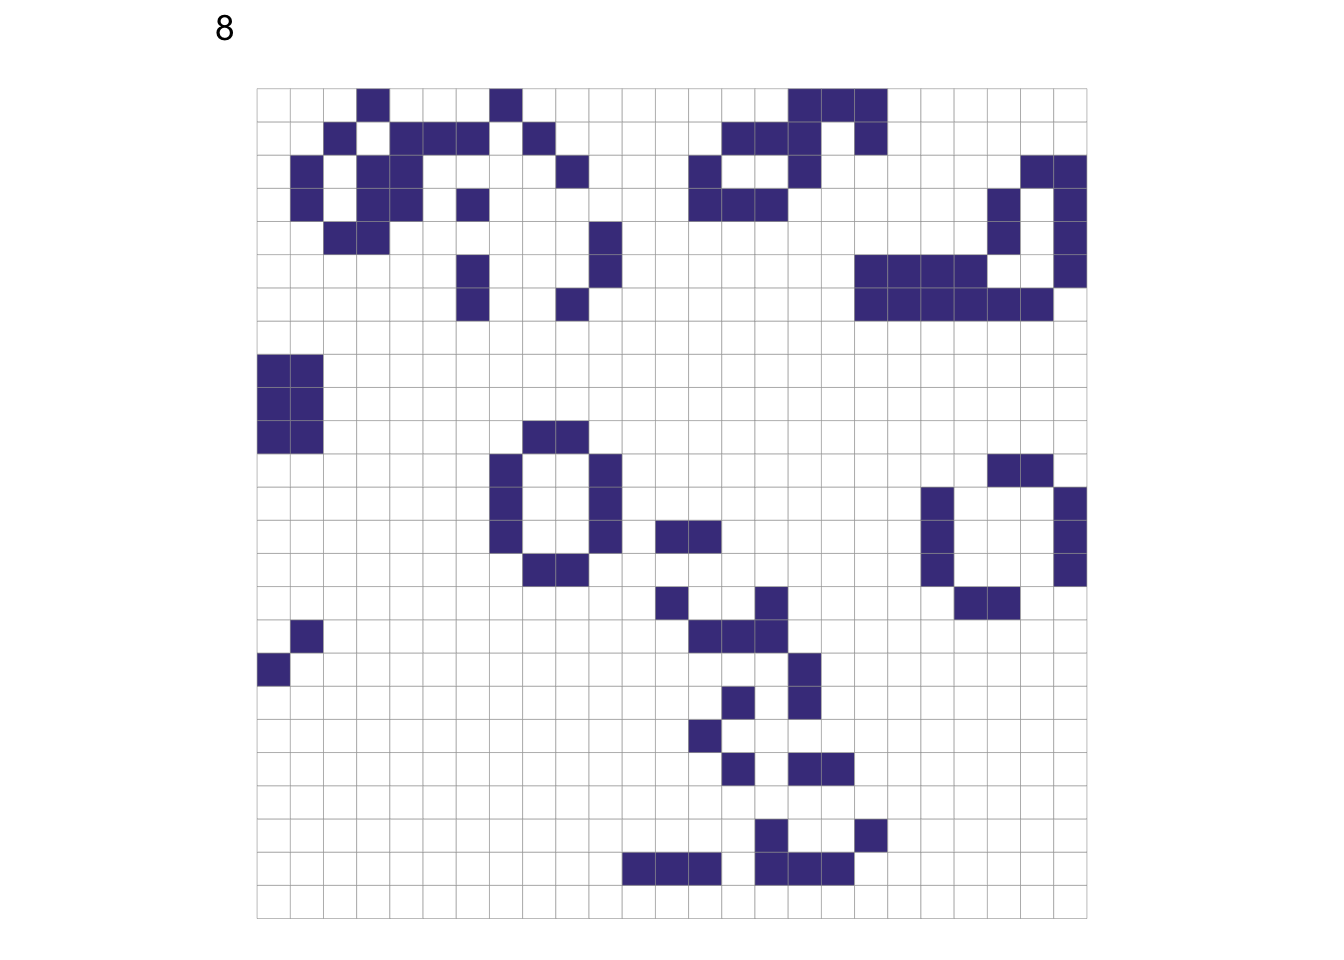
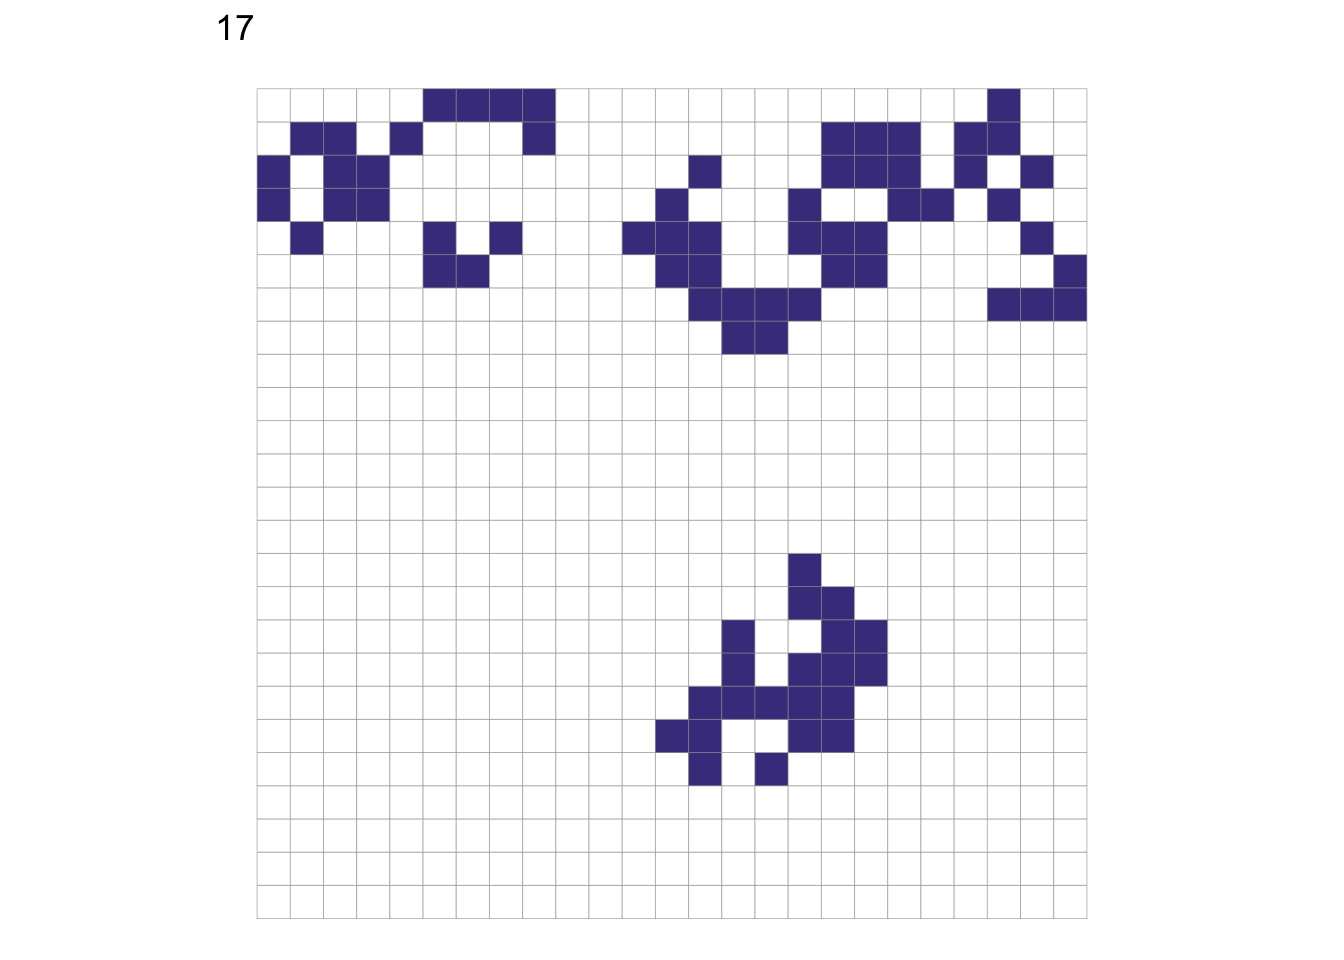
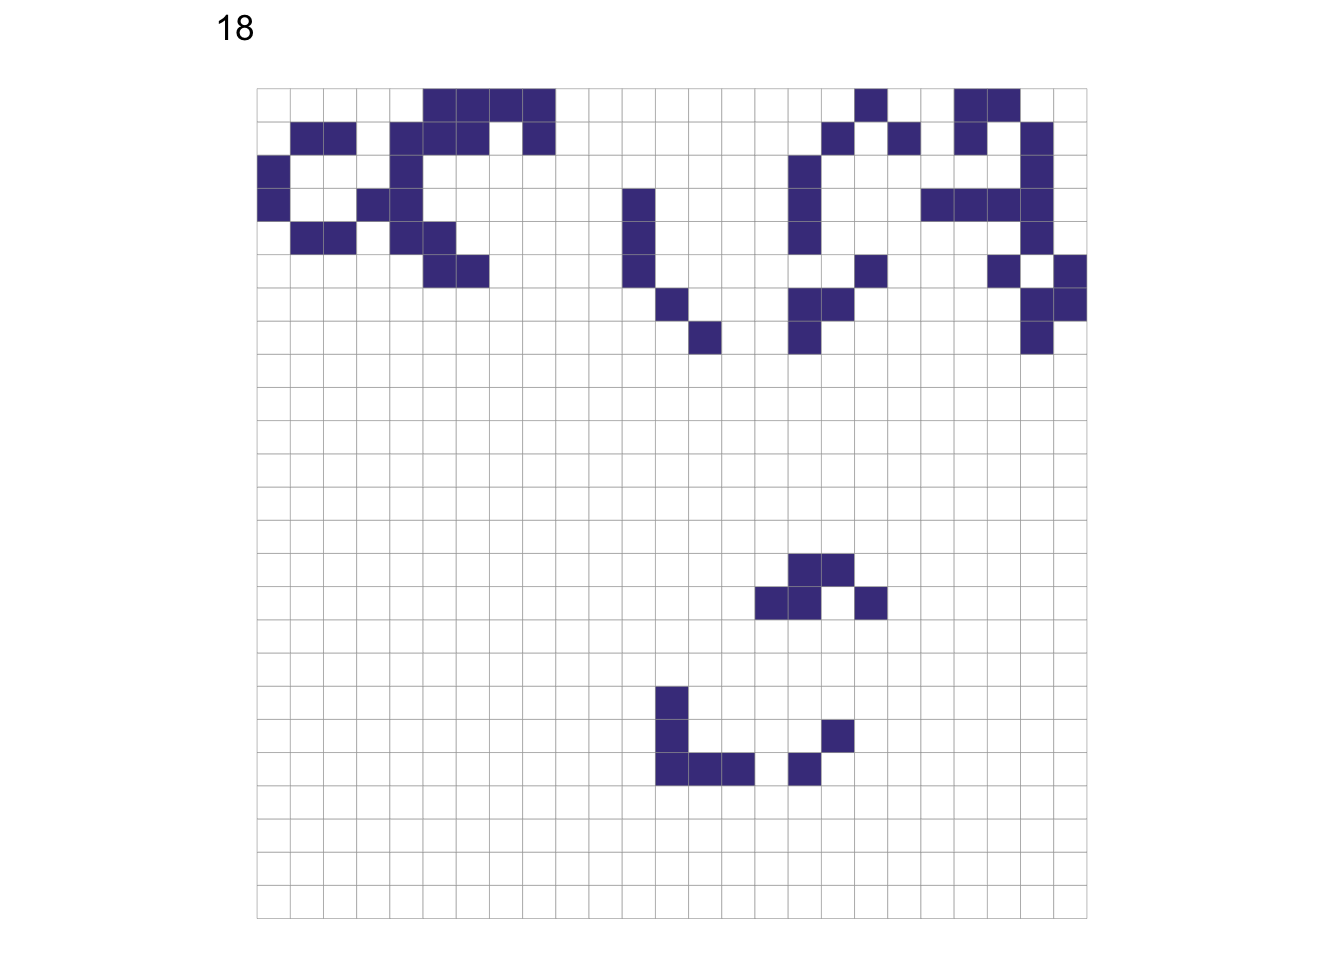
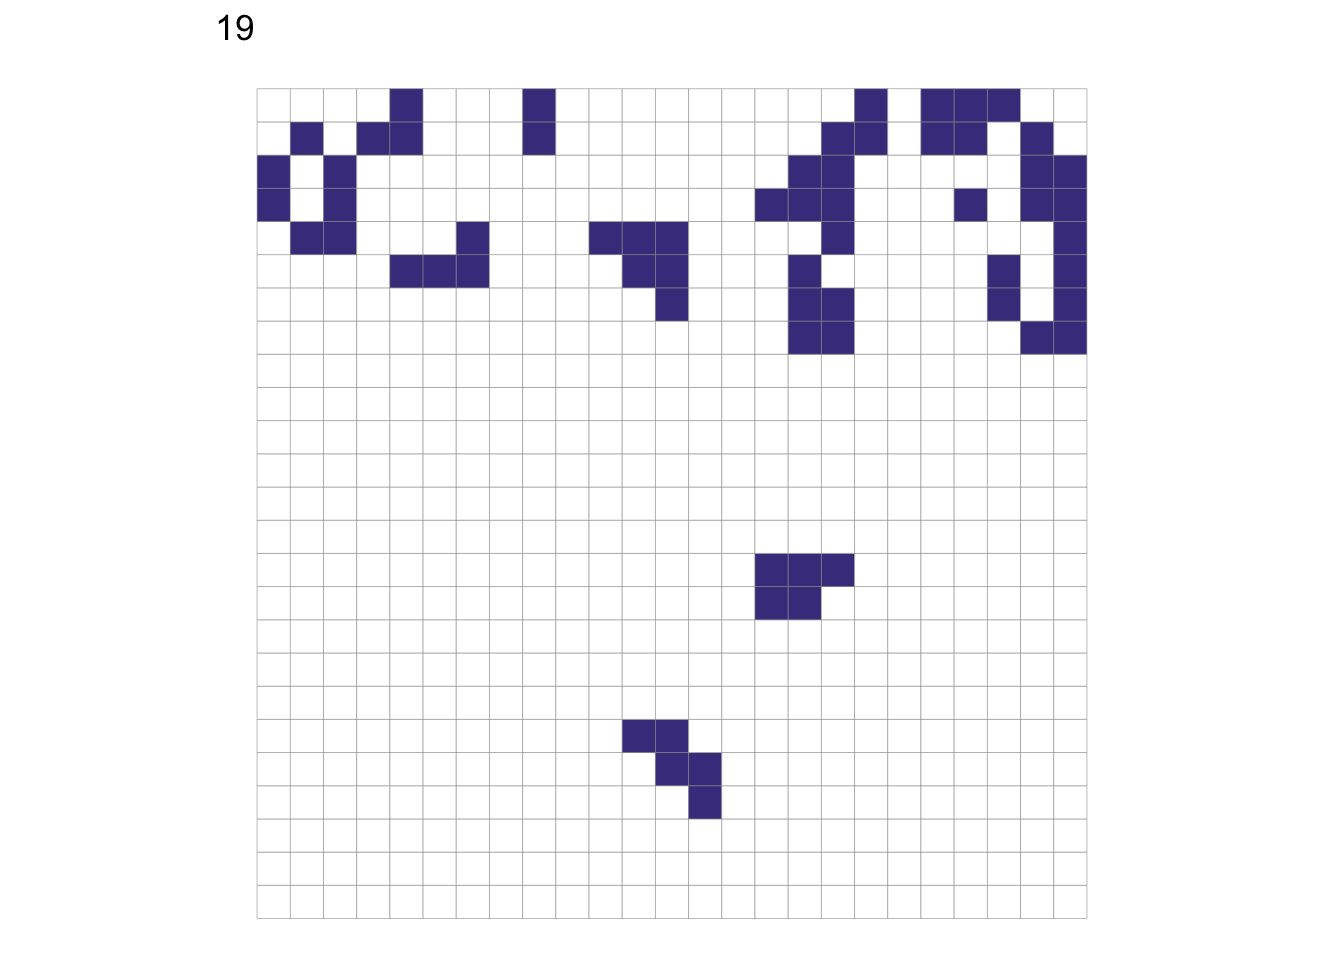
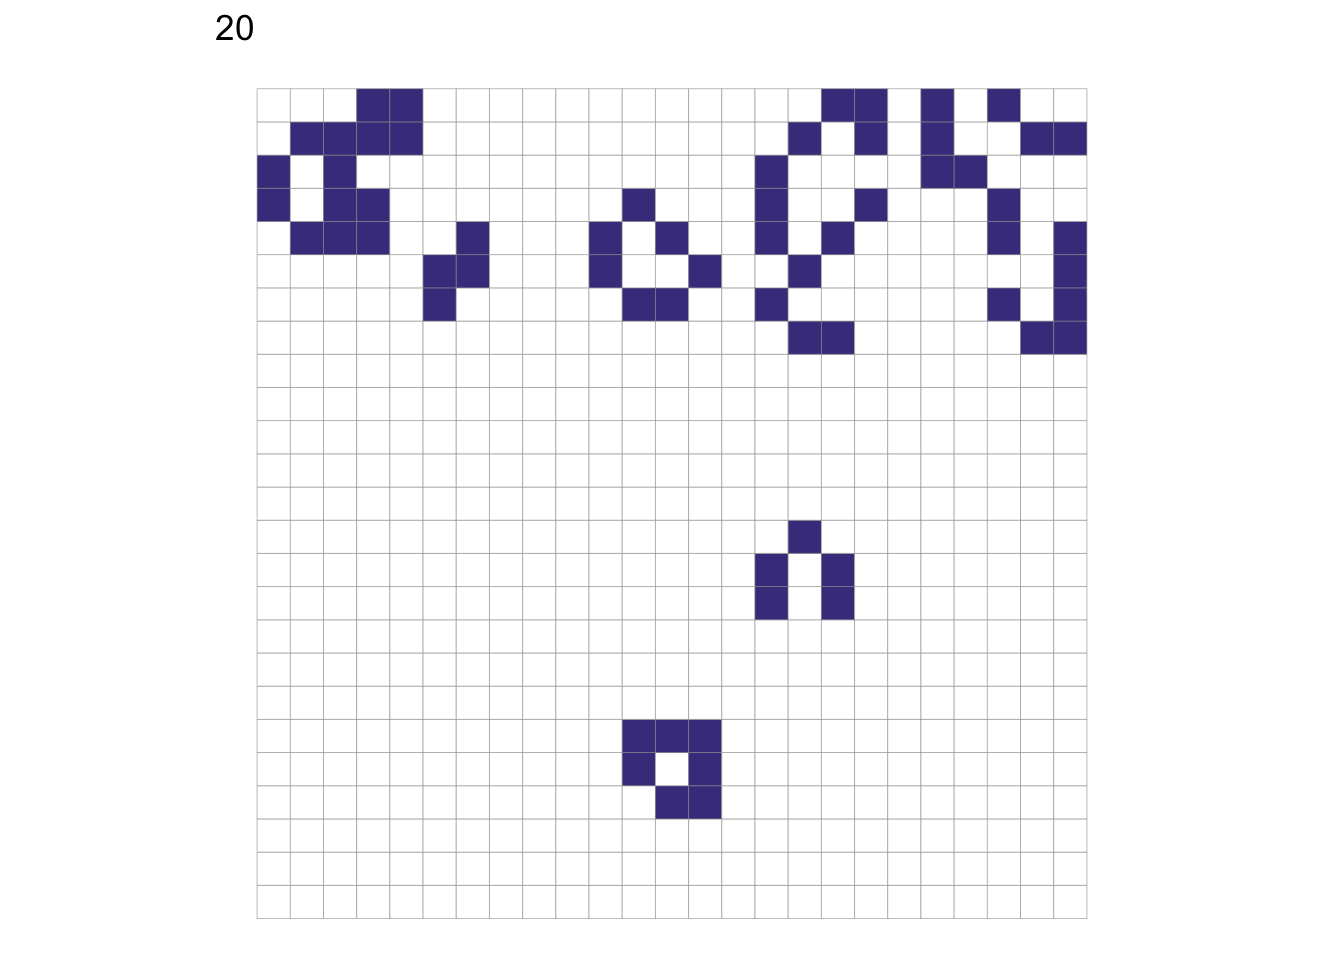
It then creates a grid and populates it randomly with “live” and “dead cells” and produces a series of plots of each generation, for as many generations as you specified.
library(tidyverse)## ── Attaching packages ───────────────────────────────── tidyverse 1.3.0 ──## ✓ ggplot2 3.2.1 ✓ purrr 0.3.3
## ✓ tibble 2.1.3 ✓ dplyr 0.8.4
## ✓ tidyr 1.0.2 ✓ stringr 1.4.0
## ✓ readr 1.3.1 ✓ forcats 0.4.0## ── Conflicts ──────────────────────────────────── tidyverse_conflicts() ──
## x dplyr::filter() masks stats::filter()
## x dplyr::lag() masks stats::lag()library(reshape2)##
## Attaching package: 'reshape2'## The following object is masked from 'package:tidyr':
##
## smiths# makes a random matrix with given dimensions
makegrid <- function(ncols, nrows, seed = NULL) {
if (!is.null(seed))
set.seed(seed)
g <-
matrix(sample(c(0, 1), ncols * nrows, replace = TRUE), ncol = ncols)
colnames(g) <- c(1:ncols)
g
}
# Function to get the sum of all the neighbors around a given cell in a matrix
get_neighbor_sum <- function(matrix, position) {
loc <- arrayInd(position, dim(matrix))
sum(matrix[max((loc[1] - 1), 1):min((loc[1] + 1), dim(matrix)[1]),
max((loc[2] - 1), 1):min((loc[2] + 1), dim(matrix)[2])]) - matrix[position]
}
# plots the matrix with black and white squares
plot_mat <- function(matrix) {
melt(matrix) %>%
ggplot(aes(
x = Var2,
y = Var1,
fill = as.logical(value)
)) +
geom_tile(color = "grey60") +
scale_fill_manual(values = c("white", "darkslateblue")) +
theme_void() +
theme(legend.position = "none") +
coord_equal()
}
# calculates a new matrix based on the neighbors of the old matrix
next_gen <- function(starting_matrix, lives = 1) {
nrows <- dim(starting_matrix)[1]
ncols <- dim(starting_matrix)[2]
results <- c()
sums <- c()
for (i in 1:(ncols * nrows)) {
sums[i] <- get_neighbor_sum(starting_matrix, i)
}
mygrid_sums <- matrix(sums, ncol = ncols)
for (i in seq_along(starting_matrix)) {
results <-
c(results, case_when((starting_matrix[i] == 1 &
mygrid_sums[i] %in% c(2, 3)) ~ 1,
(starting_matrix[i] == 0 &
mygrid_sums[i] == 3) ~ 1,
TRUE ~ 0
))
}
mymat <- matrix(results, ncol = ncols)
return(mymat)
}
# Final function that plots the starting matrix and the lives that follow
gens <- function(ncols,
nrows,
lives = 1,
seed = NULL) {
starting_matrix <- makegrid(ncols, nrows, seed)
plot(plot_mat(starting_matrix) +
ggtitle(1))
for (k in 2:lives) {
starting_matrix <- next_gen(starting_matrix)
plot(plot_mat(starting_matrix) + ggtitle(k))
}
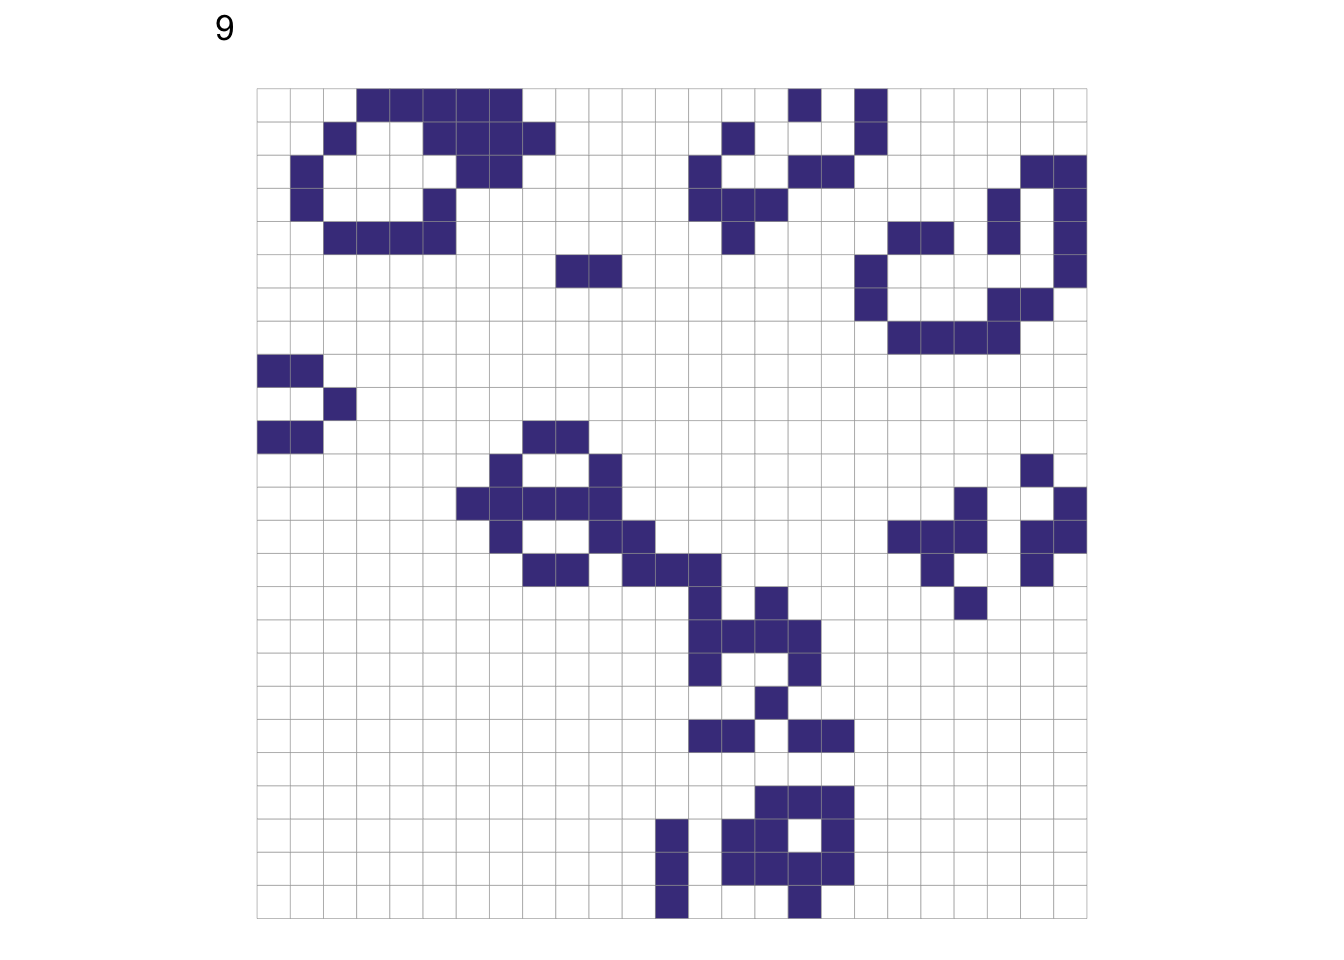
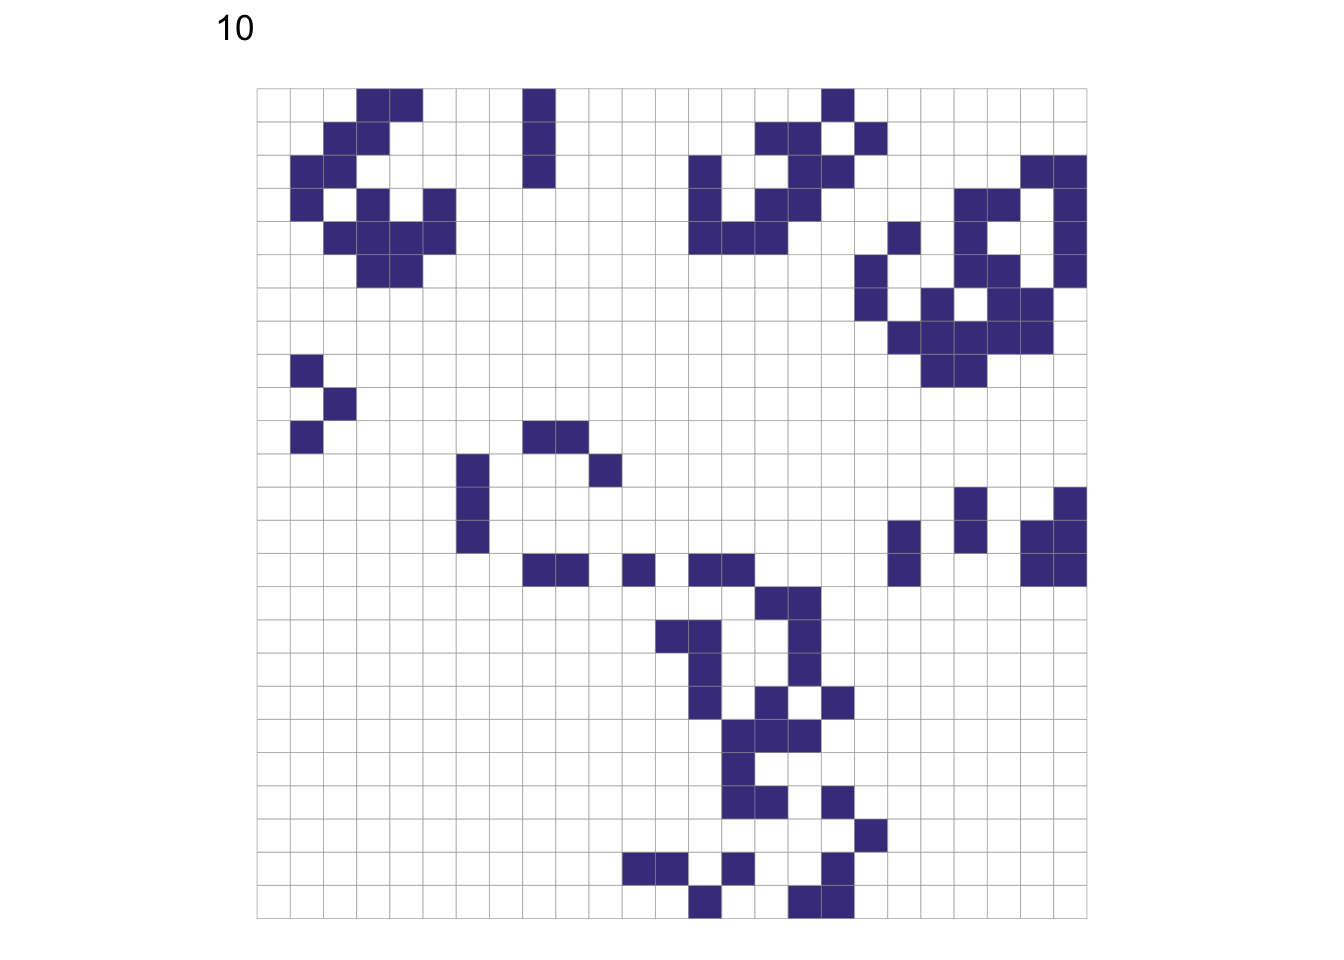
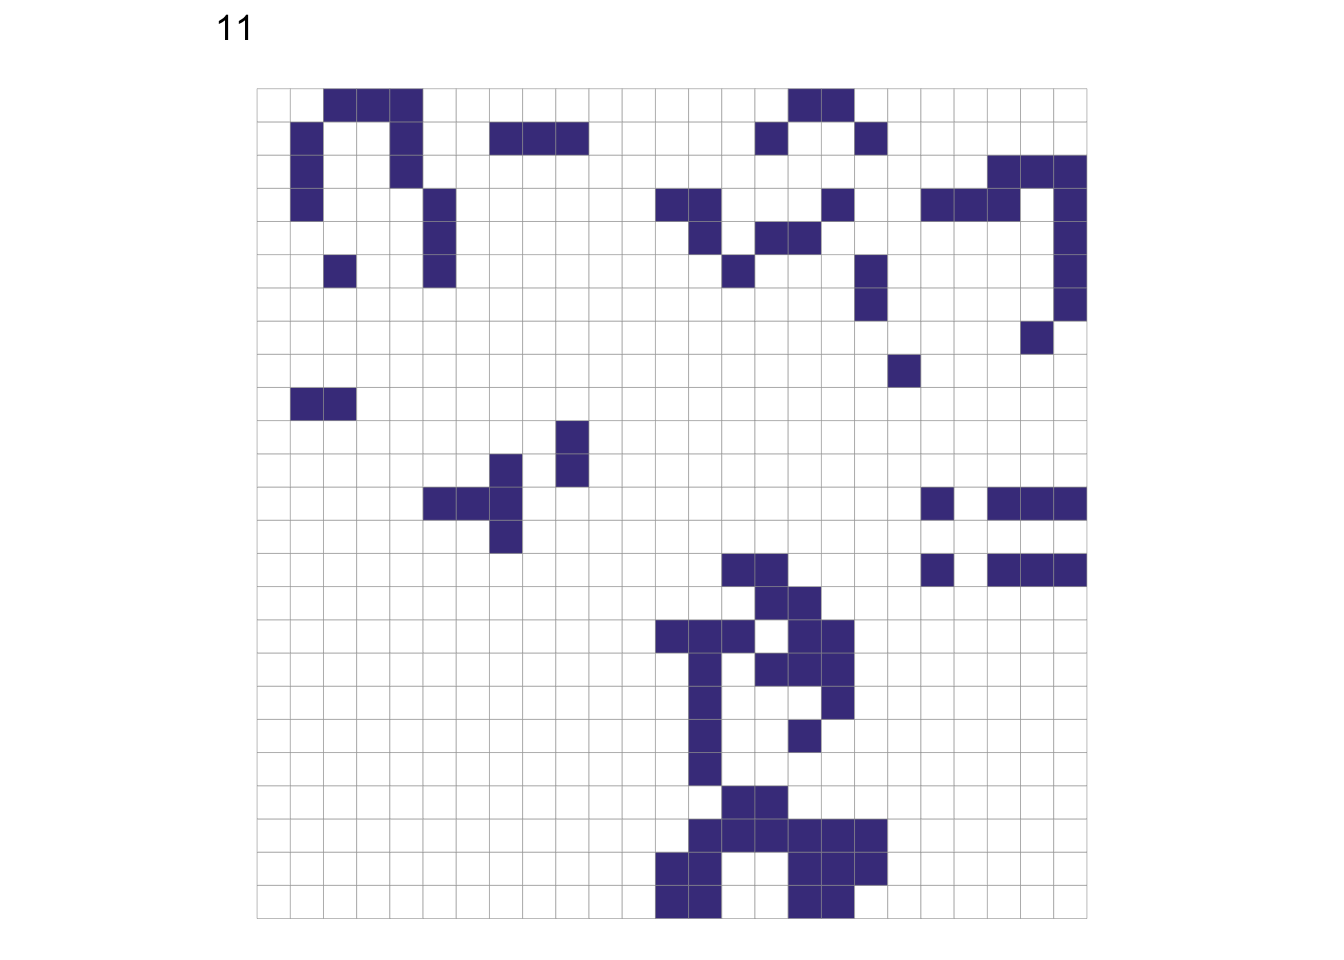
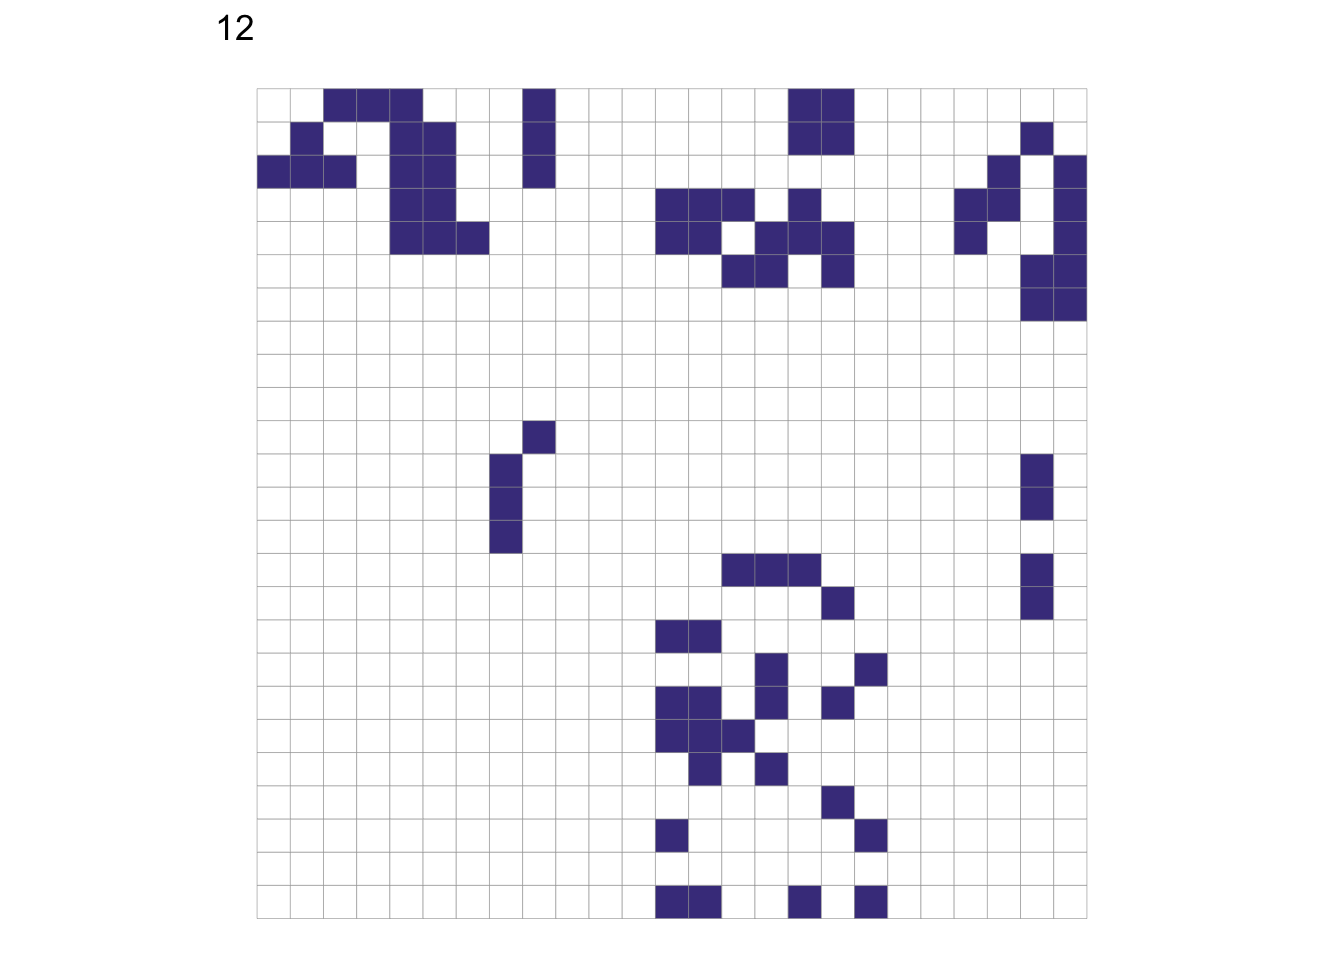
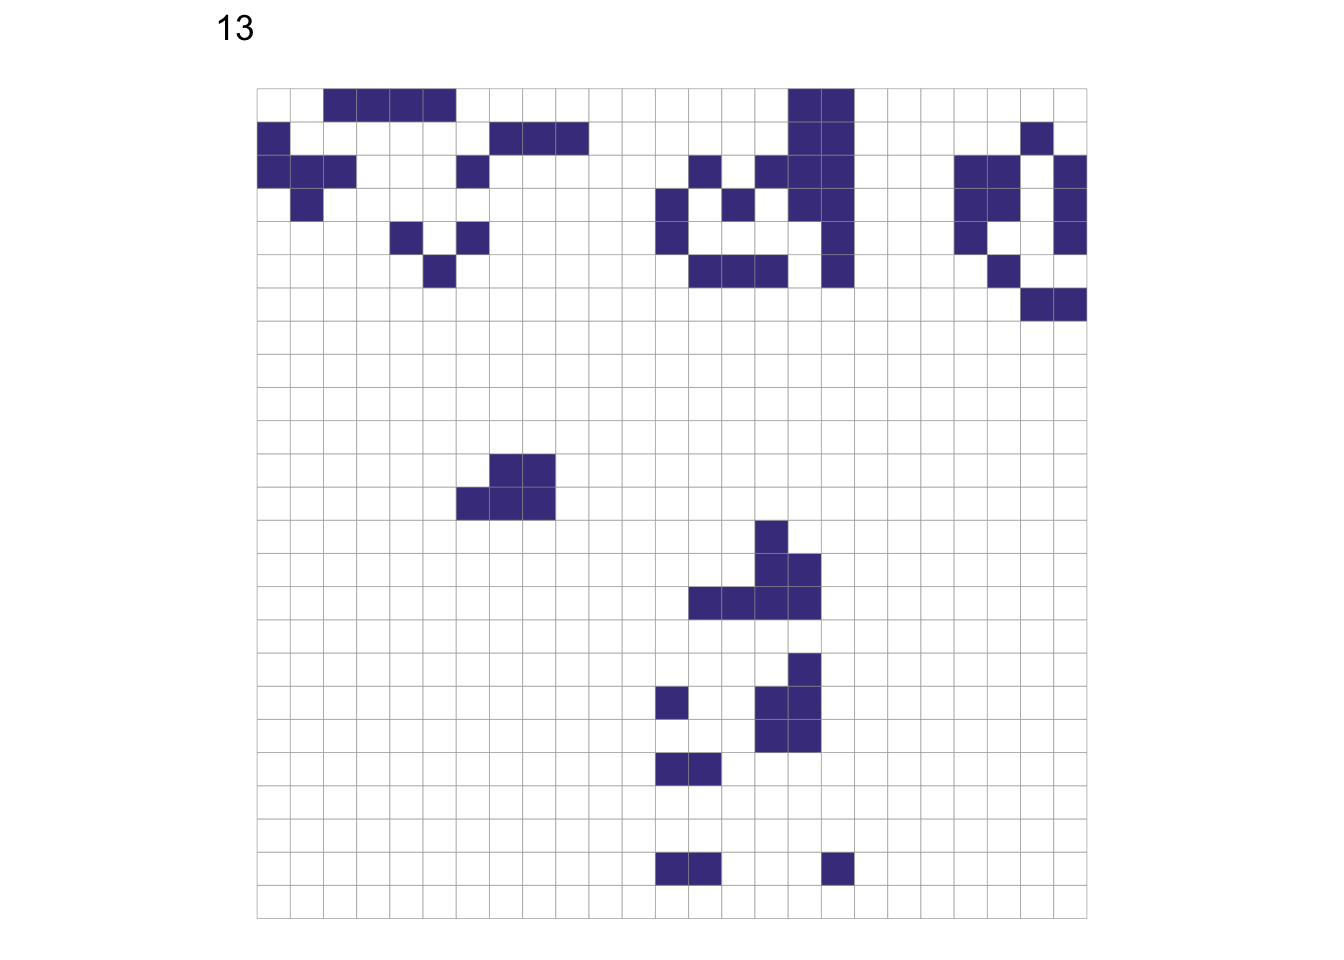
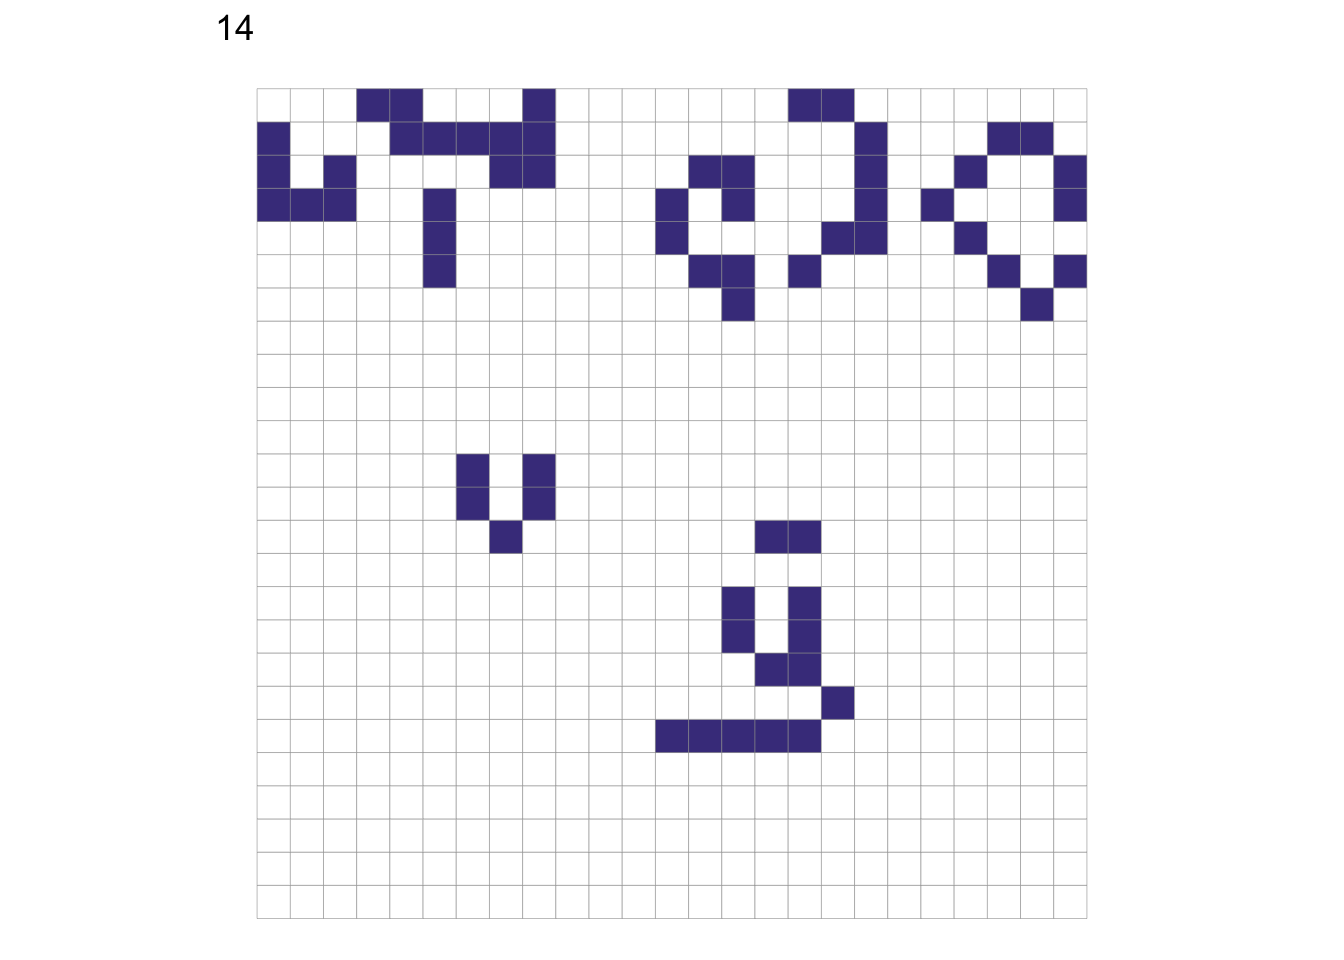
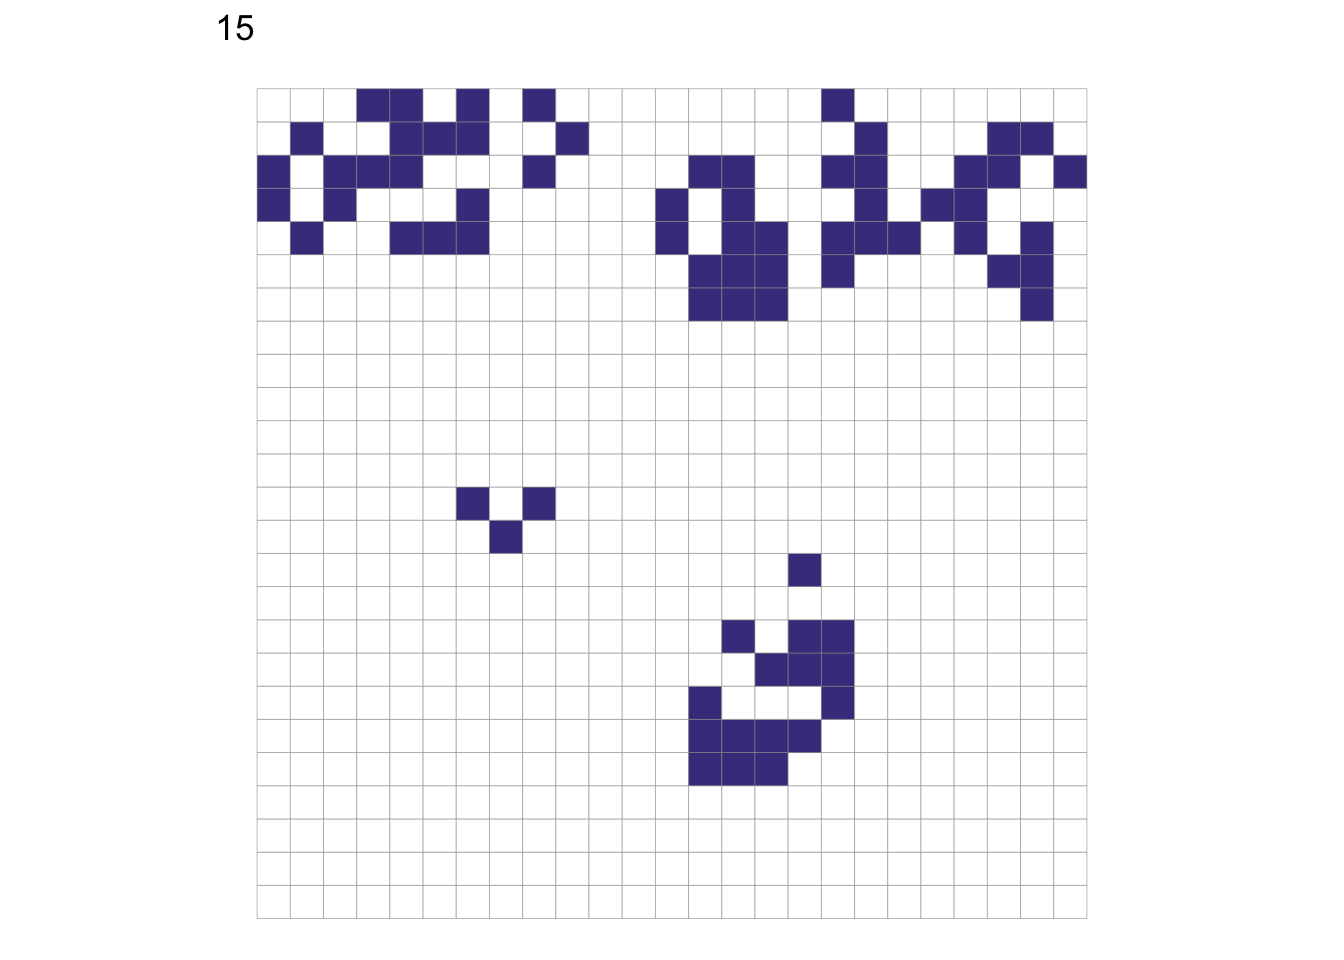
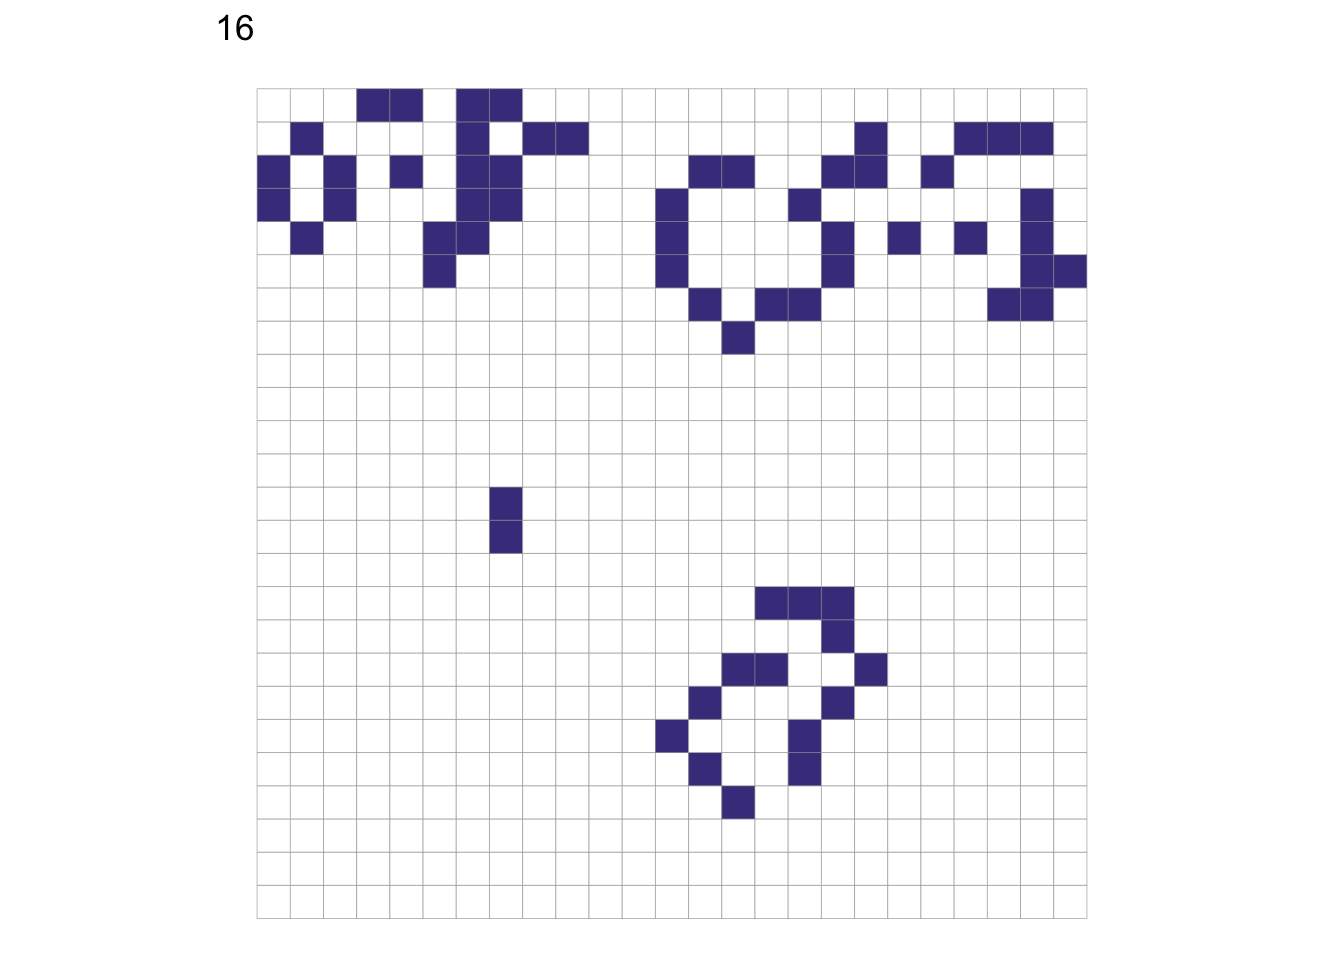
}gens(25,25, 20)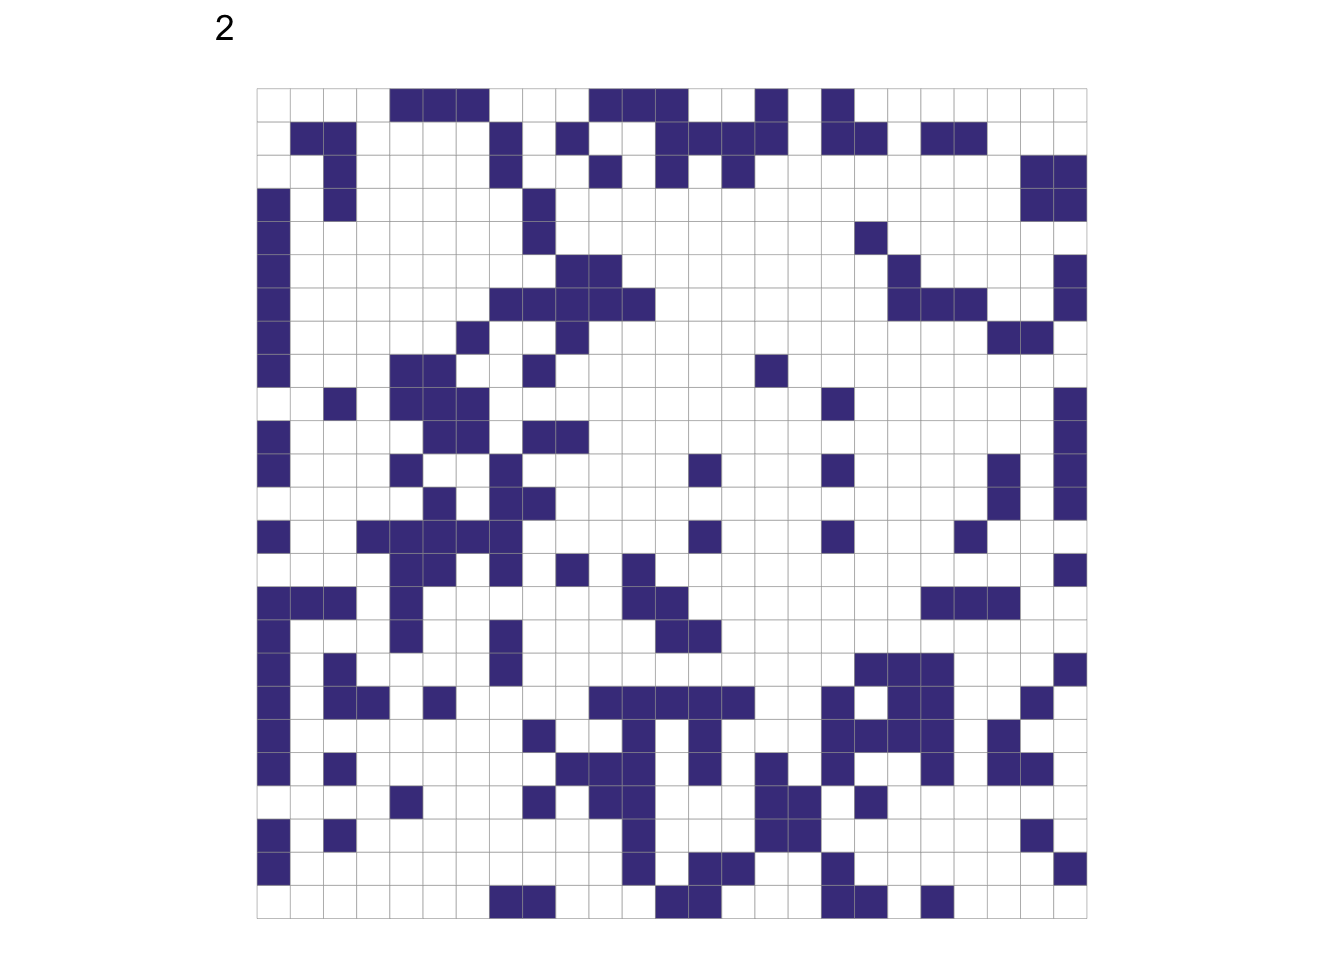
To-Do List
- Animate the result (animated gif or similar)
- Stop making new generations once a static figure has been reached - don’t waste time plotting a stuck graph